
Is there still systematic abuse of Americans by race? Is there a war on cops? Should we protect the police from criticism because we want to show respect to authority and thankfulness for the very difficult and perilous job they do each day? Are minorities more prone to higher levels of criminal behavior? If so, is this largely because of ingrained habits within their ethnic groups?
These issues bring up many strong emotions on all sides, among blacks and whites, with defenders of police behavior and the critics. The statistics behind the sensational news stories often tell a different narrative than what is promoted in the public square. I have provided a sampling below of what I found.
(This article was originally written in 2015. The same trends have continued through 2020.)
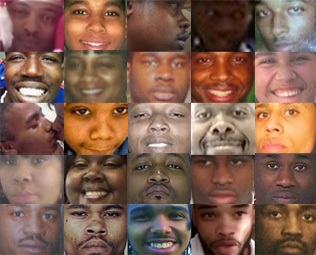
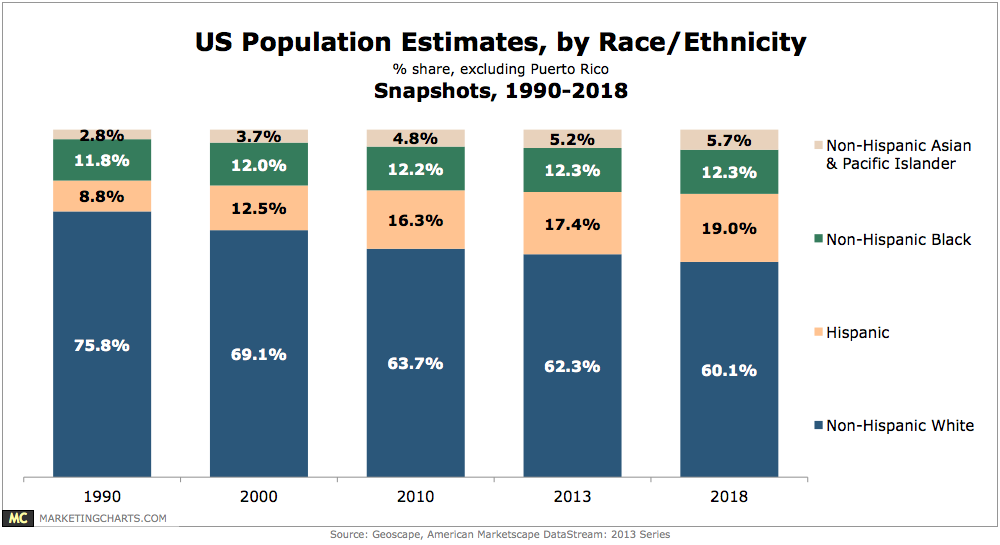
The first chart shows 385 police killings for January-May in 2015, almost 26% of which are deaths of African Americans. This occurred even though that ethnicity made up only about 12% of the population in 2013 versus 62% for whites. By the end of 2015, the total had reached 991 people, 258 of which were black (26%). 2016 was very similar: 963 killed by police.

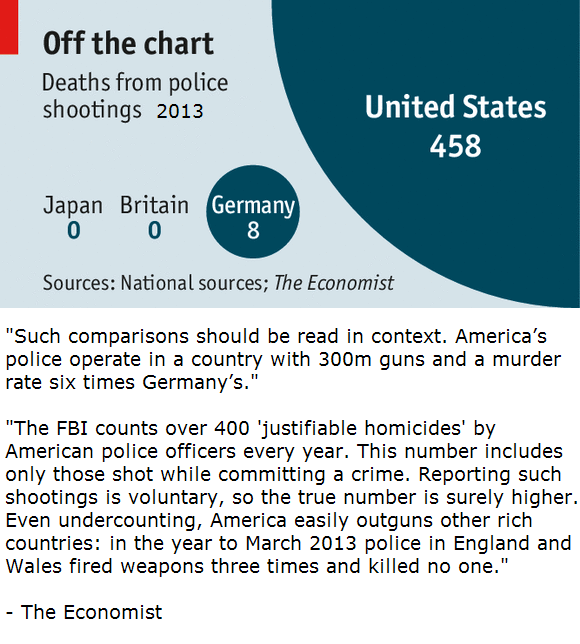
Killings by police are very rare in all other advanced Western nations. 2011 data: United States – 404, Germany – 6, Australia – 6, Britain – 2, Japan – 0. 2013: United States – 458, Germany – 8, Britain 0, Japan 0. What’s wrong with us?

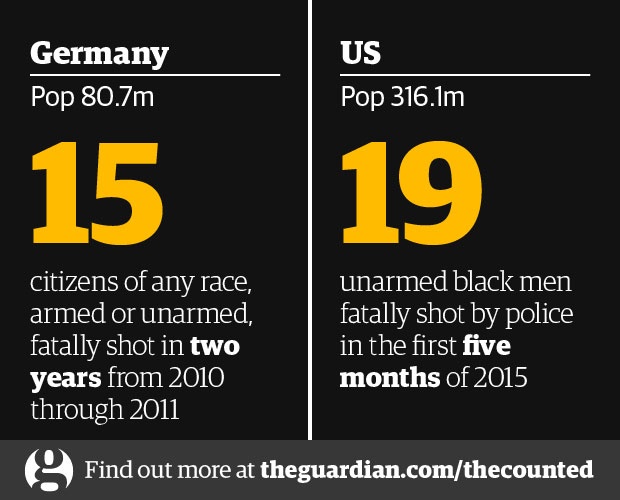
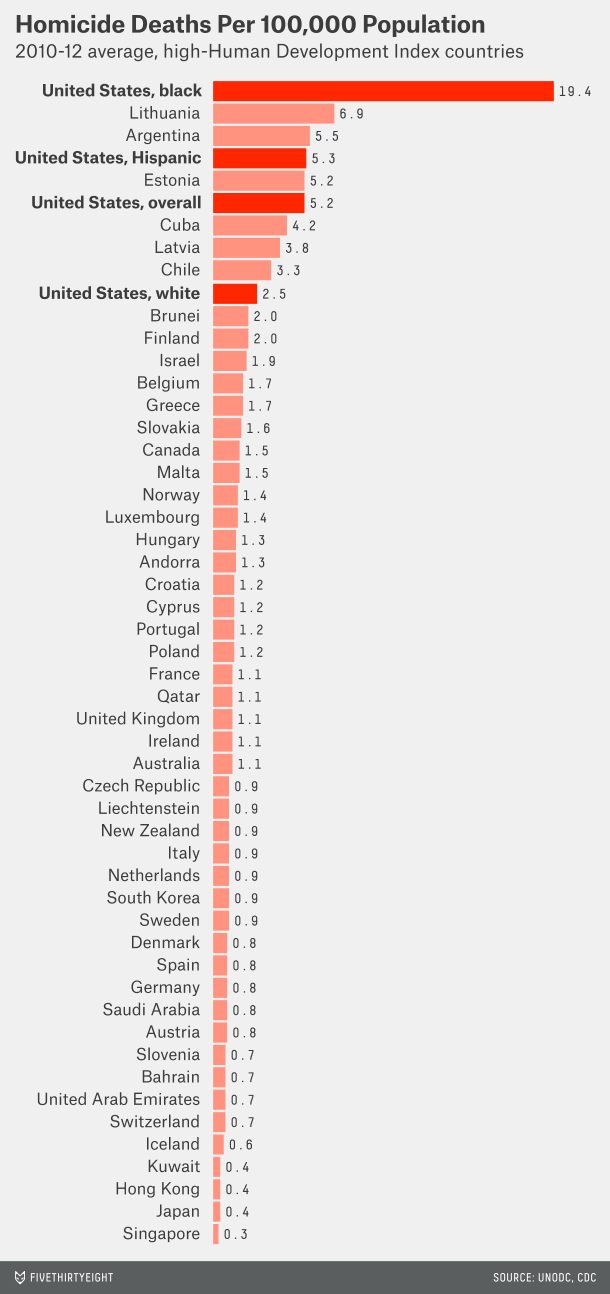
Blacks are arrested, incarcerated, killed by police and are victims of homicide at radically higher rates than whites:


Politifact interviewed criminologist Candace McCoy, a professor at the City University of New York, about this topic. She pointed to the data that show crime rates among poor blacks are typically close to that of poor whites, so that the higher felony rates in the African American community are more tied to poverty than a specific problem with the ethnic group itself. As she explained, “Felony crime is highly correlated with poverty, and race continues to be highly correlated with poverty in the USA.” The article further notes:
“[McCoy] said blacks might be more likely to have a violent encounter with police because they are convicted of felonies at a higher rate than whites. Felonies include everything from violent crimes like murder and rape, to property crimes like burglary and embezzlement, to drug trafficking and gun offenses. The Bureau of Justice Statistics reported that in 2004, state courts had over 1 million felony convictions. Of those, 59 percent were committed by whites and 38 percent by blacks. But when you factor in the population of whites and blacks, the felony rates stand at 330 per 100,000 for whites and 1,178 per 100,000 for blacks. That’s more than a three-fold difference.”
Regarding a study titled, “Household Poverty And Nonfatal Violent Victimization, 2008–2012”, the Bureau of Justice Statistics summarized their findings this way:
**Persons in poor households at or below the Federal Poverty Level (FPL) (39.8 per 1,000) had more than double the rate of violent victimization as persons in high-income households (16.9 per 1,000).
**Persons in poor households had a higher rate of violence involving a firearm (3.5 per 1,000) compared to persons above the FPL (0.8–2.5 per 1,000).
**The overall pattern of poor persons having the highest rates of violent victimization was consistent for both whites and blacks.
**However, the rate of violent victimization for Hispanics did not vary across poverty levels.
**Poor Hispanics (25.3 per 1,000) had lower rates of violence compared to poor whites (46.4 per 1,000) and poor blacks (43.4 per 1,000).
**Poor persons living in urban areas (43.9 per 1,000) had violent victimization rates similar to poor persons living in rural areas (38.8 per 1,000).
**Poor urban blacks (51.3 per 1,000) had rates of violence similar to poor urban whites (56.4 per 1,000).

Blacks in America are far more impoverished than whites, by a factor of 13 times:
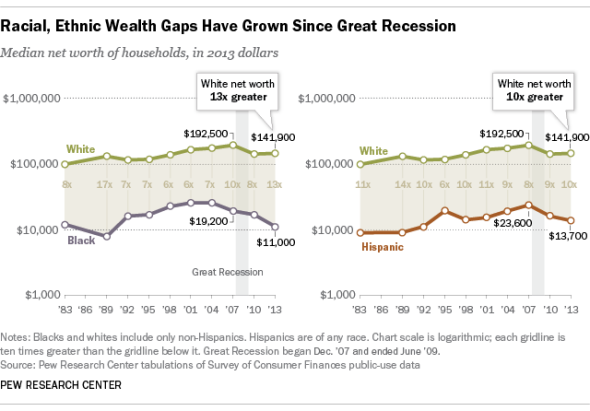
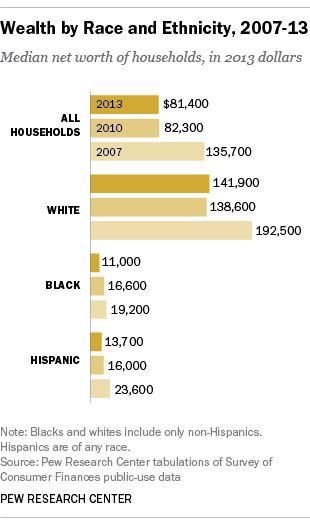
If other metrics are used, the gap becomes many times larger, so that “the median white family is worth, roughly, 69 times more”:


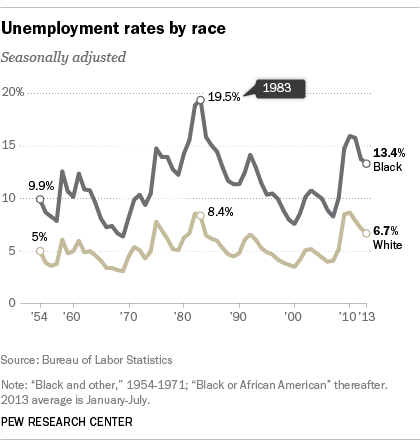


The income difference between white and black communities is startling:

Compared to the poverty rates above that include 27% of the American poor being black, which is twice the proportion of the population they constitute, the percentage of poor children being black is tragically higher at almost 40%:
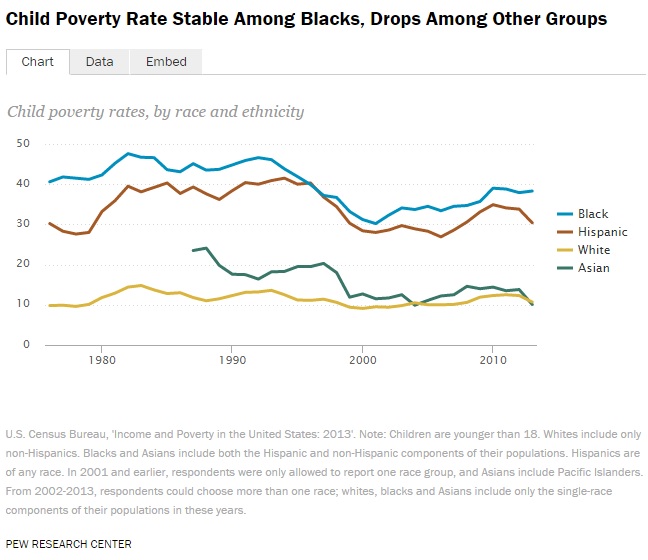
Note these 2010 U.S. Census Bureau statistics that again reveal the rate of child poverty for blacks (and Hispanics) is approximately double the percentage of the population that they represent:
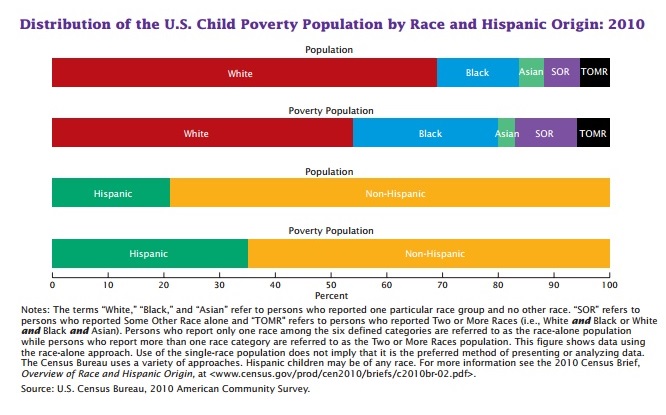
In 2013, the actual number of black children in poverty reached very close to rising above that of their white peers, even as whites of all ages equal an approximately 7 times larger section of the population in America:

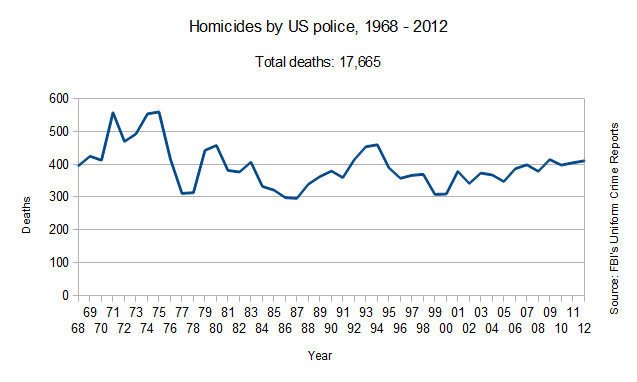
Attacks against police are not going up, though there have been some terrible incidents that have made headlines in recent years. In contrast, the rate of killings by police has been gradually increasing since the early 1990s. Between 2008 and 2013, the number of assaults upon officers dropped by almost 20% and on through 2015, all following a conspicuous trend downward since the mid-1970s. Since the late 19th century, violence toward law enforcement authorities has become seriously out of control twice – during prohibition around the 1920s and among the social upheaval of the mid 1960s-early 1970s. Violent crime across the country, including within the worst major cities, has gone down by about half since the early 1990s, while the rate of police homicides has risen to an opposite degree. FBI data show that between 1973 and 2008, rape decreased by 80% and murder became 40% less common. From 1993-2012, rates of illegal activity went down in categories of violent crime (48.2%), forcible rape (34.5%), robbery (55.9%), murder and nonnegligent manslaughter (50.5%), aggravated assault (50%), burglary (39.1%), motor vehicle theft (62.1%), larceny/theft (35.4%) and property crime (39.7%). For example, total homicides per year dropped by approximately 70% in Los Angeles and 80% in New York City. Even with the recent rise of murders in Chicago, referenced often in the news and by politicians claiming that crime is out of control, the number of murders each year between 2004-2015 was still about half as many as the average from 30-50 years ago. This happened even though the population for the City of Chicago has remained nearly the same size since the crime decline began. The national trend has continued. So, why are the instances of violence by police still so high and even increasing?


Even the very conservative American Enterprise Institute has debunked the idea that there is a “war on cops” and recognizes the numbers show a decrease. They explained this in an article titled, “Is there really a ‘war on cops’? The data show that 2015 will likely be one of the safest years in history for police.”


Although many people have the idea that occurrences of blacks killing other blacks is incredibly high, the trend during the past two decades shows a similar rate as with white killings of other white people. The annual reports from the FBI titled, “Crime in the United States”, for 1995-2012, reveal that the absolute number of white on white homicides were five to seven times larger than black on white homicides. Both categories decreased by more than 35% during that time period:

As Politifact explained, “A day after a black activist was kicked and punched by voters at a Donald Trump rally in Alabama, Trump tweeted an image packed with racially loaded and incorrect murder statistics.” The meme wrongly claimed that 2% of blacks were killed by whites instead of the correct number of 8%, blacks killed by blacks at 97% instead of correct 90% rate, whites killed by whites at 16% instead of actual number at 82% and whites killed by blacks at 81% instead of correct amount of 15%. It also asserted that the rate for blacks killed by police was 1% and whites killed by police was 3% instead of the fact that 4 times more blacks are killed by police, even though whites make up a 5 times larger portion of the total U.S. population. The cited source for the erroneous data was the “Crime Statistics Bureau – San Francisco”, an organization that doesn’t exist.

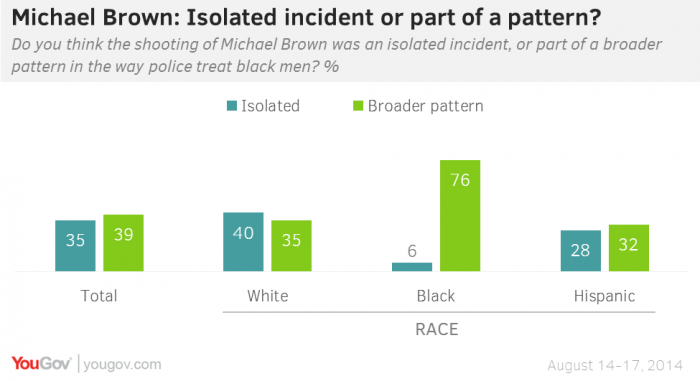
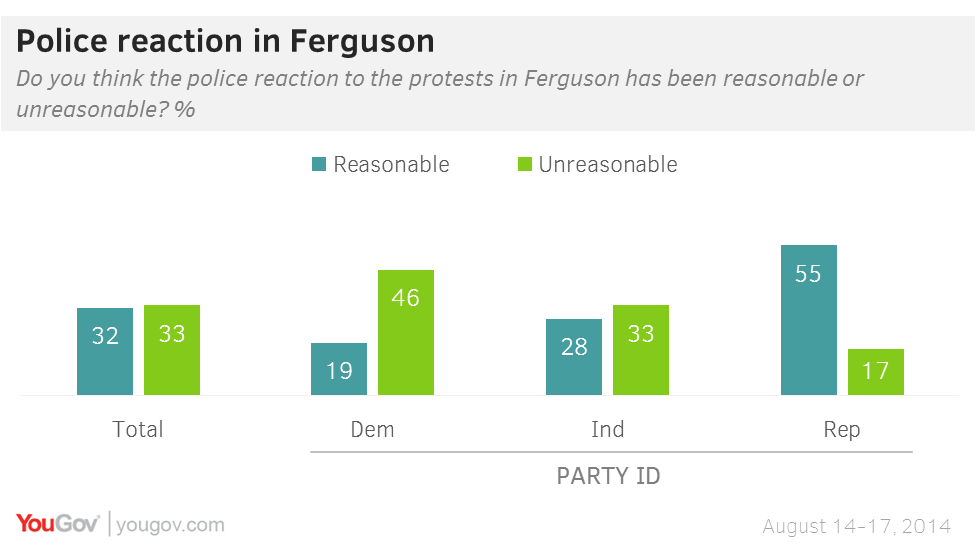
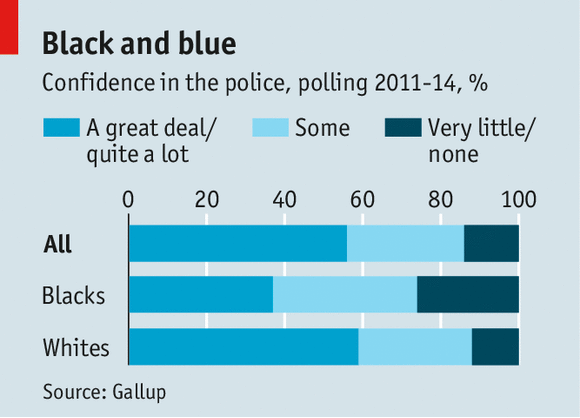
Given the long and turbulent history of race problems in America, it’s not surprising that surveys of trust levels toward the police and the perception that systemic racism is prevalent vary widely among whites and blacks and between Democrats and Republicans:

To focus on a specific location, one could look at New York City. The killings by police and stops by police here during the past decade or so have been very much disproportionately black. For example, stops by police tallied at 52% for blacks between 2004-2012 compared to their much smaller section of the population at between 25% and 30% in census data from 2000 and 2010. Encouragingly, the city police’s Stop and Frisk program that tended to engage African Americans significantly more than other ethnicities has been greatly diminished in practice, largely because of the strong negative reaction the police department received from much of the local community – they called for more humane treatment. Newsweek reported in August 2014:
“Stops peaked in 2011—with the NYPD conducting 685,724 stops that year—and began to decline dramatically in 2012….In 2013, there were 191,851 stops, down 64 percent from 2012, and 72 percent from 2011, according to a new report by the New York Civil Liberties Union.”


A similar problem occurred in Boston, where the 2010 population was about 24% black and this people group constituted 63% of the encounters with police during 2007-2010:

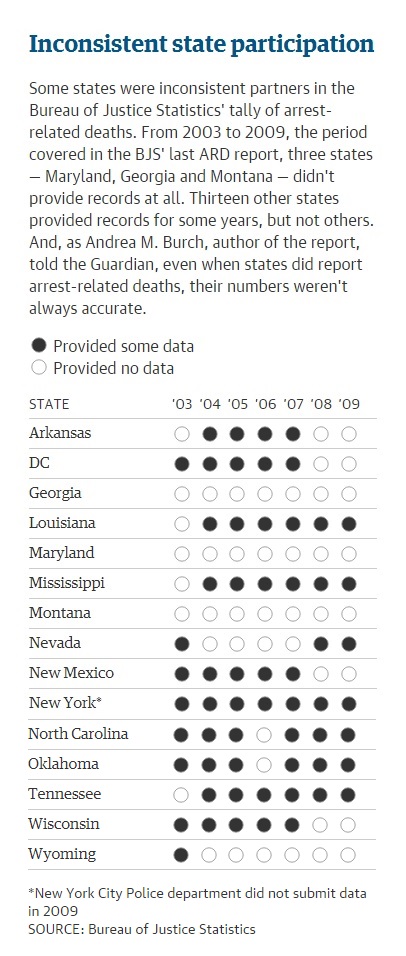
There is a wide discrepancy between the annually reported FBI numbers and the much higher actual total amount, due to the lack of unified methods of counting killings by police among counties and states across the nation:


Here are some passages from two articles on this subject that summarize a lot of relevant research:
———————————————
…more whites than blacks die as a result of an encounter with police, but whites also represent a much bigger chunk of the total population.
The Centers for Disease Control and Prevention keeps data on fatal injuries from 1999 to 2011 and one category is homicides by legal intervention. The term “legal intervention” covers any situation when a person dies at the hands of anyone authorized to use deadly force in the line of duty. Over the span of more than a decade, 2,151 whites died by being shot by police compared to 1,130 blacks…
…Brian Forst, a professor in the Department of Justice, Law and Criminology at American University, said this difference is predictable.
More whites are killed by the police than blacks primarily because whites outnumber blacks in the general population by more than five to one,” Forst said. The country is about 63 percent white and 12 percent black…
A 2002 study in the American Journal of Public Health found that the death rate due to legal intervention was more than three times higher for blacks than for whites in the period from 1988 to 1997…
Source: Politifact
——————————————————————–
This is according to an analysis by this newspaper of federal data in the wake of high-profile officer-involved shootings in Cleveland, Beavercreek and Ferguson, Mo. All three of the victims in these shootings were black and were either unarmed or carrying a realistic-seeming toy or BB gun.
When adjusted for population, the data shows black people were twice as likely to be killed by police than whites. Blacks are also disproportionally more likely to come in contact with police as suspects in violent crimes…
In 2012, the most recent year for which data is available, 386 whites and 140 blacks were killed by police, according to U.S. Centers for Disease Control data on causes of death.
In Ohio, blacks made up 50 percent of the killings by police — 10 of the 20 recorded deaths — though they make up just 13 percent of the state’s population…
Police shootings up, violent crime down
FBI statistics show that violent crime has declined for years — from 1.39 million crimes reported in 2008 to 1.16 million in 2013. But blacks account for a disproportionate number of those crimes. In 2013, 5,375 blacks and 4,396 whites were listed as suspects in murder cases, with the alleged perpetrator unknown in about 4,000 cases. Slightly more than half of the victims in these murders were black.
At the same time, the number of people killed by police has steadily climbed since 2008 — from 381 that year to 550 in 2012.
Source: Journal-News

Thanks for the heads-up on the CDC and “homicides by legal intervention!” Your article came up first since your title is identical to the search terms I used.
LikeLike
Glad to be of service. 😀
LikeLike
Hi again, Louis. I just wanted to let you know that I added a lot of new content to this article.
A month ago, I gave a presentation on this subject to a book group that I belong to. I had found many charts/graphics to show the statistics related to this topic. More than a dozen of them have been newly included here and I typed up lots of commentary too.
Check it out if you feel so inclined.
🙂
LikeLike
Very informative! I hope your article expands way past WordPress
LikeLike
Thanks!
I’ve been submitting articles to newspapers all month long, so hopefully I’ll get published soon. I would like to research and write for a living. Currently, this blog and a lot of dialoguing elsewhere online and writing of shorter articles are part of a non-paid passionate commitment and huge investment of time and resources outside of my regular job. I enjoy the work and find it rewarding. I know that I’m finding and sharing important information that most people don’t know about. I learn a lot from feedback that readers give me too.
LikeLiked by 1 person
awesome!
LikeLike
Reblogged this on penpowersong.
LikeLike
Absolutely brilliant. Fantastic job. I live in Chicago. I get it.
LikeLike
Thanks!
LikeLike
Reblogged this on Rethinking Life and commented:
Important research. While this is important for everyone, those in cities really need to know the truth. Racism kills.
LikeLike
So do drugs and criminals. Plus we are the wild wild west where owning guns is considered a right that must never be revoked or even challenged. The gun lobby had a lot to do with the election of Trump.
LikeLike
Thanks for visiting my blog and following.
LikeLike
Excellent article – you had to do a lot of research for this. Thank you for the follow and it’s good to meet you.
LikeLike
Thanks!
LikeLiked by 1 person
😉
LikeLike
Thanks for the follow. It’s refreshing to read a blog wherein comments are backed up with source material for the numbers quoted. I don’t often see this in the hurried world we live in. You make excellent points and would have loved to be in that book club wherein the subject was discussed. I bet it was a great presentation and discussion. Sheri
LikeLiked by 1 person
I found you through you following lexitheschnauzer.com blog. Your blog is really first class, with everything needed to be informative. May I make a suggestion? If it was me (and I couldn’t do half as well as what you have done, but please let me make just this one suggestion) I would have broken it up into about three blogs over 3 days. It’s just a bit too much to take in all at once. In any case, keep up the good work. And Merry Christmas!
LikeLike
Thank you.
I write much shorter articles (2-3 paragraphs) on Facebook, which have many times developed into full pieces on this site. This blog originally developed as a one-stop location to share all of the relevant info that I found on particular topics about which I dialogue, research, write and debate often online.
I may break up this article, “Police Killings By Race”, into smaller parts later. I did that with my articles on Trump. Originally, they were online as a five part article series. I broke them up into smaller topical parts and received good feedback. One of these shorter versions even became my first ever professionally published article:
pastemagazine.com/articles/2016/11/15-key-foundations-of-trumps-political-viewpoint-t.html
🙂
LikeLiked by 1 person
I will be interested in reading that. Thanks. Oh, and I can see why you were published. 🙂
LikeLiked by 1 person
Very dense collection of facts here. You lay out some interesting questions at the start. You should add your conclusions at the end.
LikeLike
The questions are answered throughout the article. Which ones do you see as not being answered?
LikeLike
For example, the first question you ask is “is there systematic abuse by race”. You give a lot of data, but I don’t see you drawing a conclusion on that question. While statistics are clear that, for example, more blacks per capita are killed than whites by police, you don’t explicitly tie that outcome to abuse. Maybe you were intending just to present the facts, which I respect. I think a lot of the causes are poorly understood, and probably go back to a number of factors.
LikeLike
Thanks for the feedback. I’ll consider what you said.
LikeLike
Fantastic job here with your data and research. This is a very touchy subject and always will be. One issue with it is the lax punishment doled out to police officers that have been caught on camera killing someone or committing the act of police brutality. As a teenager in the 90s growing up in L.A., the Rodney King beating will never be forgotten. For anyone who watched the video, it’s a debacle that the four officers who beat him walked away without any jail time. Their acquittal led to the L.A. Riots. I’m not a minority but that doesn’t matter. It’s still hard to watch a cop kill someone on camera in what looks to be unjustified and then find out they walk away unpunished after going through the judicial system. I can see why this subject angers a lot of people. There’s a legitimate case here.
LikeLike
Thanks, aaronpkahle. Did you also check out the charts from the conservative American Enterprise Institute? They show that our current decade is a comparatively very safe time for police officers. The high levels of deaths occurred during Prohibition and the high crime wave of the late sixties to early nineties. There is currently no widespread “war on cops”, as many people on the far right keep claiming.
LikeLike